Solana has marked bullish momentum from August to November, after which there was the formation of lower low peaks, and the coin began to decline towards its support zone. The SOL coin was moving below the downtrend line, and during the end of January, the coin began to ascend but couldn’t close above $121 and then fell to $81. Yesterday, there was a formation of a bullish candle with a hike of 7%. Since the past month, the coin has been moving in the sideways channel in between the price range of $122 and $81.
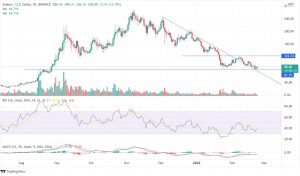
On the above chart, the MACD line and the signal line overlap each other. The RSI is at 40, which indicates moderate bearishness, and The volume bar shows mixed momentum. If the price of Solana continues to trade upwards and closes above $105, a bullish momentum can be expected till the next resistance of $122. Based on the recent price formation and SOL crypto price prediction, the coin may initiate recovery soon.
If we look at the weekly time frame, the coin is getting tested at the support line and hasn’t yet closed below it though there has been the constant formation of bearish candles from the last three weeks. The technicals have been in the bearish zone since December. In the previous week, there was a price movement of 23% in favor of bears. Still, the coin holds the possibility of upside movement, which can be an opportunity for the traders to book profits.
